


 Español
  Information
Dra. Marissa Calderón-Torres
Unidad de Biomedicina (UBIMED), FES Iztacala, UNAM.
View publications
S.N.I.I. level I.
mcalderontorres![]() iztacala.unam.mx
iztacala.unam.mx
 Home
Teaching strategies
Tests
HW simulator
Genetics characters
DEHA
Home
Teaching strategies
Tests
HW simulator
Genetics characters
DEHA
| Home Infographics Documents Credits Contact | 
 Login
Login
|
|
|

Hardy-Weinberg simulator

Introduction
The Hardy-Weinberg Law states that genotypic and phenotypic frequencies in a population remain constant from one generation to the next when inheritance is Mendelian and there are no disturbing factors. Given a gene with two alleles A and a, the phenotypic frequencies AA, Aa and aa will remain constant over generations.
Intuitive assertions
One of the origins of the Hardy-Weinberg law comes from a controversy between two intuitive but contradictory points of view: a) In a population, the phenotype of the dominant gene will end up, after a few generations, having a frequency of 75%. b) After several generations, a balance will be reached in the frequency of the phenotypes, but not necessarily the dominant one being the highest. This controversy is the one to which Godfrey Harold Hardy, English mathematician (1877-1947), gave a solution in an elegant, concise and short “Letter to the Editor” in the magazine Science (Hardy, 1908), explaining in a direct and unambiguous way. doubt, that intuition (a) is incorrect, and mathematically demonstrating that (b) was correct. In his explanation, he establishes through a very simple equation the relationship between the allele frequencies of the parental generation (for example, A and a) and the genotype frequencies of the descendant generation (for example, AA, Aa and aa). . That equation is precisely the core of the “Hardy-Weinberg Law.” As often happens in science, in that same year, and independently, Wilhelm Weinberg (1862-1937), a German doctor, discovered that same relationship or law, which is why the “Law” is named after both characters. .
The Punnett Square
The allele frequencies of a gene with Mendelian inheritance can be represented graphically in a table of the mother's alleles vs. the father's alleles. If both parents are heterozygous, then the picture may be as shown in Figure 1. 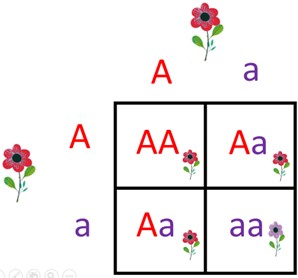
Figure 1. Punnett square. Using an orthogonal representation, the alleles of one parent are placed in the columns and those of the other parent in the rows. The table is filled with the diploid combinations of the alleles in the corresponding column and row. The table then allows us to know the genotypic frequencies of the offspring of the immediate generation.
Using an orthogonal representation, the alleles of one parent are placed in the columns, for example A and a, and the alleles of the other parent are placed in the rows. The table is filled with the diploid combinations of the alleles in the corresponding column and row, in this case, one of the combinations AA, Aa, or aa. The table allows us to know the genotypic frequencies of the offspring of the immediate generation. For example, for the table in Figure 1 we have 1xAA, 2xAa and 1xaa, the frequencies are then 1:2:1, or in percentages 25:50:25. Figure 2 shows that the offspring of the cross between a heterozygote (Aa) and a recessive homozygote (aa) results in 50:50, while the cross between a dominant homozygote (AA) and a recessive one (aa) results in 100:0. The case in which the cross is between two heterozygous parents (Aa x Aa) results in offspring with proportions 25:50:25 for AA:Aa:aa. For some reason Yule (who argued the a view of the controversy) wrongly sensed that as generations passed, balance was achieved precisely in the proportions 25:50:25, but Punnett (who argued the a view of the controversy) b) he sensed, correctly, that this was not necessarily the case. Balance means that the generation produces offspring with the same allele frequencies, that is, the A:a ratio is the same from one generation to the next. The name “Punnett Square” is due to the English geneticist Reginald Crundall Punnett (1875 – 1967), who told Hardy about his intuitive idea, and the latter formalized it mathematically. 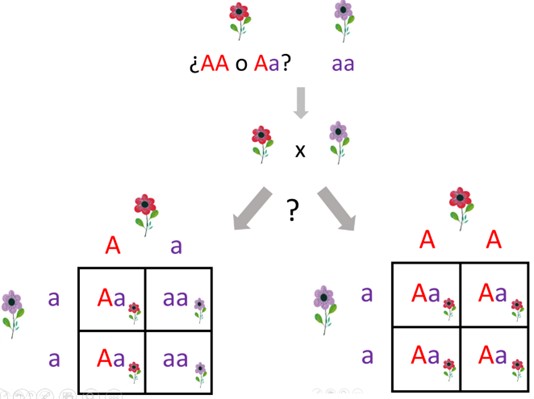
Figure 2. Example of application of the Punnett square. Based on the proportions of the offspring, it can be known whether the parent with the dominant phenotype (red flower) is recessive (Aa) or homozygous (AA). In the first case the proportions are 50:50, in the second case 100:0.
The Hardy-Weinberg Law
What the Hardy-Weinberg Law states is that the proportions of alleles are the same from one generation to the next. The Law is usually expressed in terms of allele frequencies using the equation of a square binomial and its development: (p+q)2 = p2 + 2pq + q2 Let's think that the left side of the equation represents the allele frequencies in the parental generation, while the right side represents the frequencies of the AA, Aa and aa phenotypes of the offspring. So, what the equation tells us is that the allele frequencies of the second generation are also p and q, that is, they are the same as that of the parent generation. Suppose we have a population with genotypic frequencies 25:50:25 for AA, Aa and aa, respectively. The phenotypic frequencies will then be: 75 for the dominant character (25+50) and 25 for recessive. The allele frequencies will be: 100 for allele A (2x25 + 50) and 100 (50 + 2x25) for allele a. If the population is in Hardy-Weinberg equilibrium, then the proportions of alleles will remain constant from one generation to the next. The equation relates in an elegant way to the three types of frequencies. Now let's express the frequencies in proportions:
Its Allele Frequency A = 100;
Proportion of alleles A = 100/200 = 0.5 = p The development of the square binomial (p+q)2 is: (p+q)2 = p2 + 2pq + q2 (0.5+0.5)2 = 0.52 + 2x0.5x0.5 + 0.52 (0.5+0.5)2 = 0.25 + 0.5 + 0.25 which can be interpreted as the proportions of the genotypes of the descendant generation are:
AA = 25% Since the equation is an equality, then we know that the proportion of alleles in the descendant generation is also 0.5 for allele A and 0.5 for allele a. Thus, the equation establishes that the recessive character of a population will not disappear even after many generations, rather it will remain in the same proportion over the generations. Thus, although the proportions of the genotypes (AA:Aa:aa) can change from one generation to the next, the proportion of alleles (A:a) remains constant.
Calculation of phenotypic frequencies in equilibrium
The Hardu-Weinber Law can be useful to calculate genotypic frequencies in a population, as long as it is in equilibrium, that is, the assumptions explained in the previous section are met. Suppose we observe a population of plants with flowers of two colors: red (dominant) and lilac (recessive), in a proportion of 96% and 4%. From this data we can say that the aa genotype has a frequency of 4%, but the Plants with red flowers can have AA or Aa phenotypes, and we only know that their sum is 96%, but what proportion is AA and what is aa? then we know that the proportion of aa is 4%, that is, 0.04, which in the equation: (p+q)2 = p2 + 2pq + q2 is equivalent to the term q2, substituting q2 = 0.04: (p+q)2 = p2 + 2pq + 0.04 To know the value of q, we obtain the square root of q2: q = √0.04 = 0.2. as p + q = 1, then p = 0.8: (p+q)2 = p2 + 2pq + 0.04 (0.8+0.2)2 = 0.82 + 2x0.8x0.2 + 0.22 (0.8+0.2)2 = 0.64 + 0.32+ 0.04 That is, now we know the proportions of the genotypes:
AA = 64% If the recessive character is purple flowers, and these are found in the population in 4% (and red flowers in 96%), then we can know that the genotypes of red flowers are 64% and 32%: 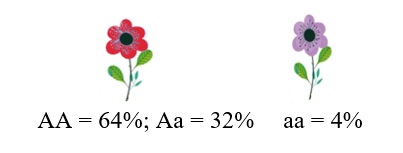
|
